

- Blog
- Electric vehicles
- EV Sales statistics
EV Sales statistics in Australia 2026
- Electric vehicles
- 5 min read
In September 2026, Battery Electric Vehicles (BEV) sales were 24.2% of all new vehicles sold in Australia, just short of the record 24.9% in August. The August results eclipsed the previous record of 23.3% in June 2026. Results from the past few months highlight the growing demand for electric vehicles in Australia.
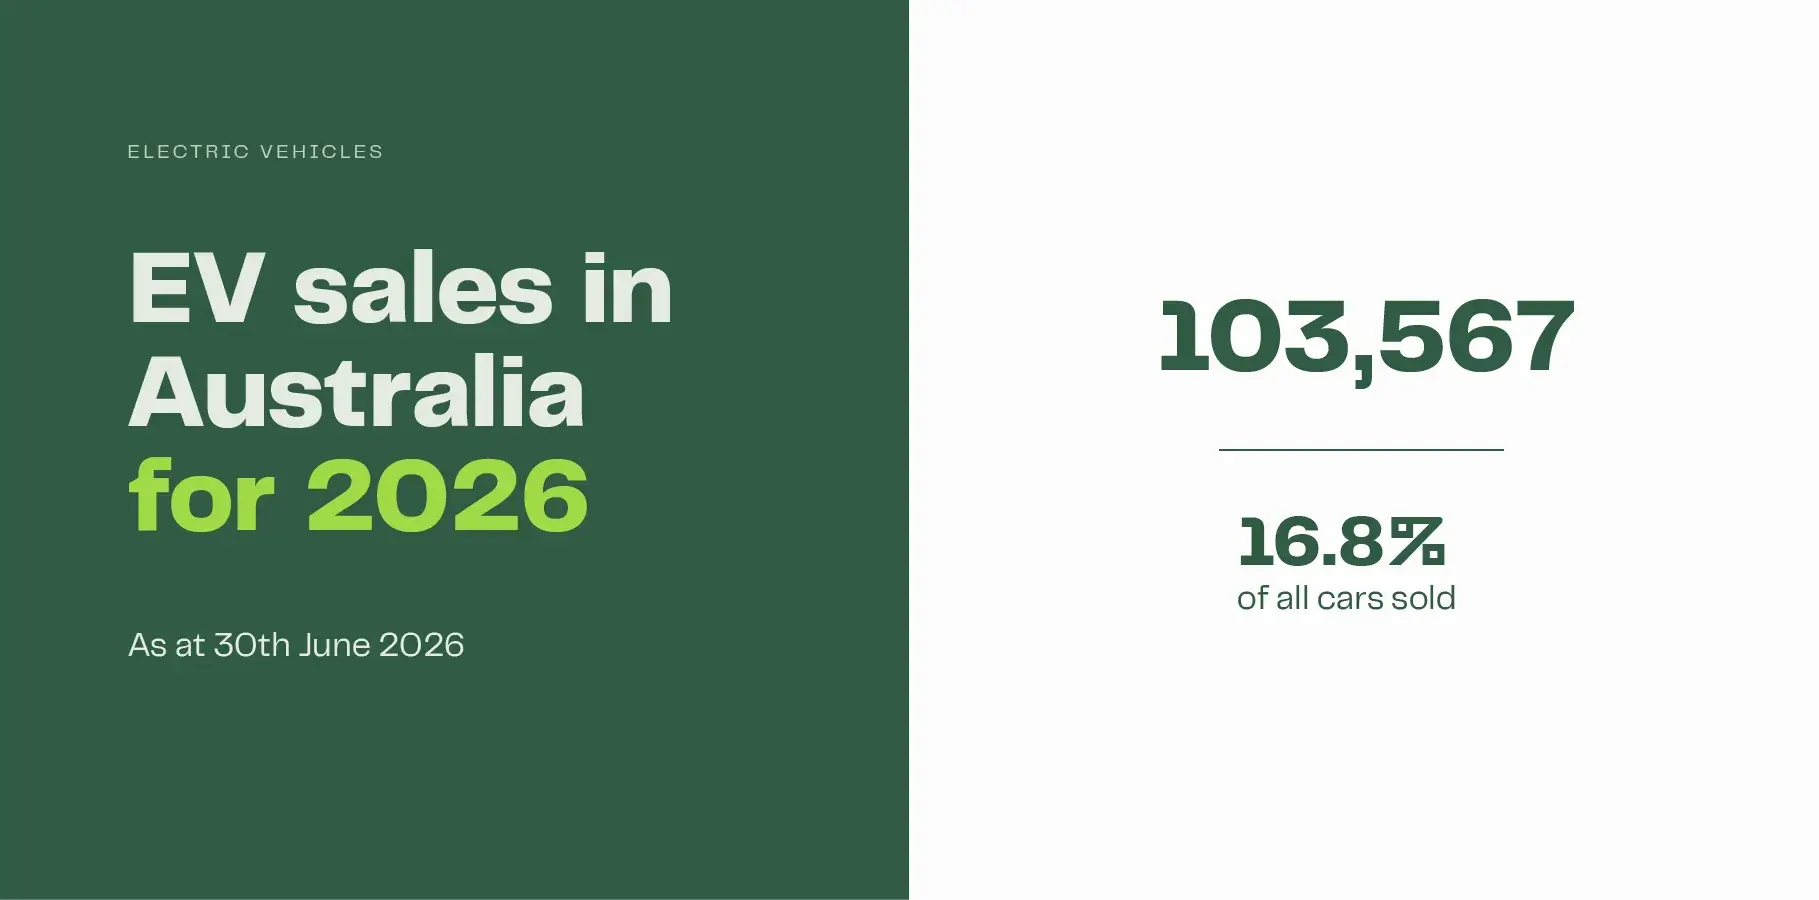
According to VFACTS data from the Federal Chamber of Automotive Industries and the Electric Vehicle Council, 180,453 electric cars have been sold in Australia in 2026 as at 30th September, representing 19.1% of all new cars sold.
EV adoption has accelerated significantly during 2026. In January, just 7,316 (8.4%) of all cars sold were fully electric. Following the outbreak of conflict involving Iran in late February and the resulting oil price spike, monthly EV sales have increased steadily to 32,583 (23.3%) in June before stabilising in July 23,510 (21.7%). The latest August and September figures, 27,089 (24.9%) and 26,287 (24.2%), show the demand for EVs is only growing stronger.
2026 Monthly EV sales statistics
More electric cars were sold in the first 6 months of 2026 than in the whole of 2025. The table below shows EV sales by month in Australia for 2026:
| Month | EV sales | Total car sales | EV market share |
|---|---|---|---|
| Jan 2026 | 7,316 | 87,092 | 8.4% |
| Feb 2026 | 11,067 | 90,712 | 12.2% |
| Mar 2026 | 15,839 | 105,058 | 15.1% |
| Apr 2026 | 15,459 | 94,049 | 16.4% |
| May 2026 | 21,303 | 100,206 | 21.3% |
| Jun 2026 | 32,583 | 140,058 | 23.3% |
| Jul 2026 | 23,510 | 108,577 | 21.7% |
| Aug 2026 | 27,089 | 108,760 | 24.9% |
| Sep 2026 | 26,287 | 108,778 | 24.2% |
| Total | 180,453 | 943,290 | 19.1% |
Australian annual EV sales statistics
The table below shows EV sales statistics by calendar year:
| Year | EV sales | Total car sales | EV market share |
|---|---|---|---|
| 2010 | 10 | 1,035,574 | 0.00% |
| 2011 | 49 | 1,008,437 | 0.00% |
| 2012 | 173 | 1,112,032 | 0.02% |
| 2013 | 191 | 1,136,227 | 0.02% |
| 2014 | 370 | 1,113,224 | 0.03% |
| 2015 | 759 | 1,155,408 | 0.07% |
| 2016 | 668 | 1,178,133 | 0.06% |
| 2017 | 1,208 | 1,189,116 | 0.10% |
| 2018 | 1,054 | 1,153,111 | 0.09% |
| 2019 | 5,264 | 1,062,867 | 0.50% |
| 2020 | 5,215 | 916,968 | 0.57% |
| 2021 | 17,243 | 1,049,831 | 1.64% |
| 2022 | 33,410 | 1,081,429 | 3.09% |
| 2023 | 87,217 | 1,216,780 | 7.17% |
| 2024 | 91,293 | 1,237,288 | 7.38% |
| 2025 | 103,269 | 1,241,037 | 8.32% |
| 2026 | 180,453 | 943,290 | 19.1% |
| Total | 527,846 | 18,830,752 | 2.80% |
Sales statistics for popular EV brands
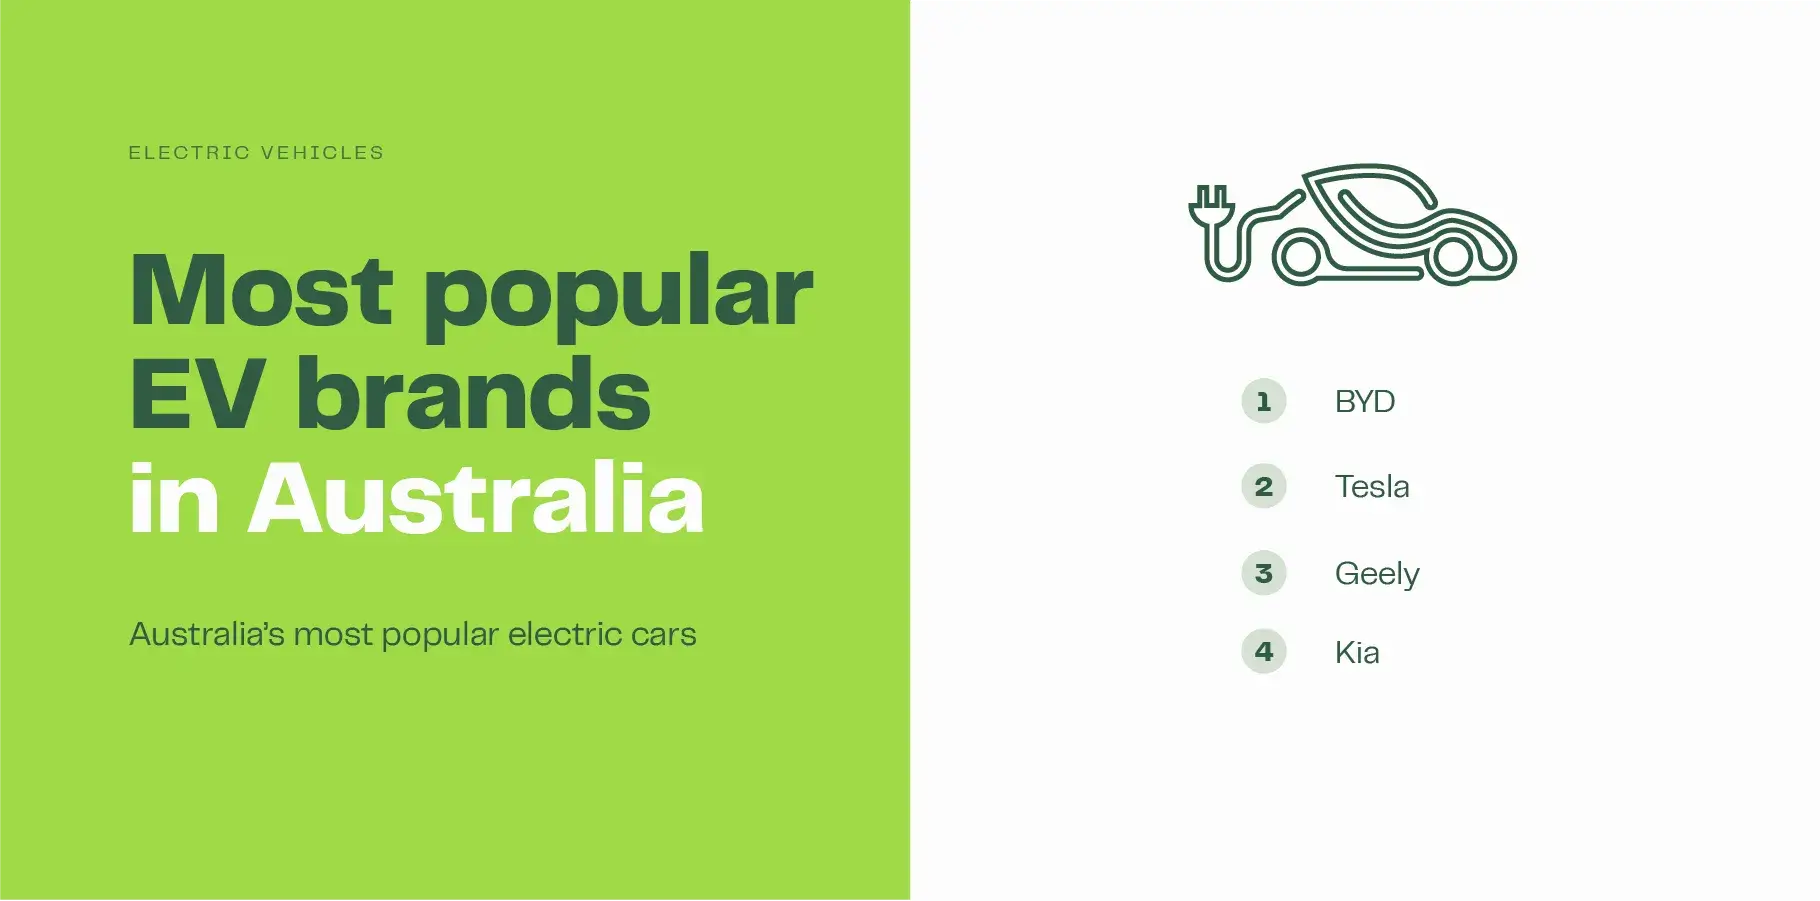
BYD and Tesla are the two strongest EV brands in Australia – between them, they account for just under half of all electric cars sold in 2026. Chinese manufacturers continue to strengthen their position in the Australian market, representing 56.9% of all electric cars sold in Australia.
Australia’s best-selling EV brands
The table below shows EV sales for major brands in Australia in 2026:
| Brand | 2026 Sales |
|---|---|
| BYD | 44,682 |
| Tesla | 41,705 |
| Geely | 15,235 |
| Zeekr | 12,120 |
| Omoda Jaecoo | 11,056 |
| Kia | 10,390 |
| MG | 9,911 |
| Hyundai | 3,267 |
| Toyota | 2,933 |
| Volkswagen | 2,723 |
Sales statistics for popular EV models
At the time of writing, the Tesla Model Y and the BYD Sealion 7, account for over 30% of all EVs sold in the country. Tesla Model Y sales currently sit at 35,930 or 19.9%, while BYD Sealion 7 sales have reached 19,964 – 11.1% of all electric cars sold.
Australia’s best-selling electric vehicles
The table below shows electric car sales for the most popular models in Australia:
| EV model | 2026 Sales |
|---|---|
| Tesla Model Y | 35,930 |
| BYD Sealion 7 | 19,964 |
| Geely EX5 | 12,745 |
| Omoda Jaecoo J5 | 11,056 |
| Zeekr 7X | 10,800 |
| BYD Atto 2 | 8,673 |
| Tesla Model 3 | 5,775 |
| Kia EV5 | 4,722 |
| Kia EV3 | 4,541 |
| BYD Atto 3 | 4,361 |
The Iran conflict and fuel price increases
The increase in fuel prices due to the Iran conflict appears to have contributed to stronger EV sales. Electric cars are cheaper to run by comparison than they were 6 months ago. Since the conflict kicked off in late February 2026, monthly sales have risen from 12.2% of all new cars in February to a high of 24.9% in August.
Several analysts have linked the rise in fuel prices directly with EV uptake. The table below uses ACCC fuel watch data to show the petrol prices pre-conflict, at the height of the fuel crisis and current prices:
| City | 20th February | 31st March | 22nd July | Increase since war began | Increase at peak |
|---|---|---|---|---|---|
| Sydney | $165.2 | $257.4 | $176.5 | 6.8% | 55.8% |
| Melbourne | $176.1 | $259.1 | $179.7 | 2.0% | 47.1% |
| Brisbane | $188.8 | $258.7 | $180.2 | -4.6% | 37.0% |
| Adelaide | $161.3 | $259.2 | $175.9 | 9.1% | 60.7% |
| Perth | $163.3 | $251.8 | $185.0 | 13.3% | 54.2% |
| Average | $170.9 | $257.2 | $179.5 | 5.3% | 51.0% |
While petrol prices increased on average 51.0% at the height of the crisis, they now sit at just a 5.3% increase on February prices, pre-conflict.
Diesel prices in 2026
It’s a similar story for diesel, though the figures are slightly different. Diesel prices are up 21.7% from February as shown in the table below:
| City | 20th February | 31st March | 22nd July | Increase since war began | Increase at peak |
|---|---|---|---|---|---|
| Sydney | $174.3 | $321.8 | $215.3 | 23.5% | 84.6% |
| Melbourne | $178.9 | $324.4 | $217.3 | 21.5% | 81.3% |
| Brisbane | $179.7 | $322.7 | $217.1 | 20.8% | 79.6% |
| Adelaide | $174.7 | $324.5 | $215.1 | 23.1% | 85.7% |
| Perth | $175.6 | $309.4 | $209.7 | 19.4% | 76.2% |
| Average | $176.6 | $320.6 | $214.9 | 21.7% | 81.5% |
A structural shift or just a fuel price blip?
The key question for the Australian EV market is whether this represents a structural shift, or is a response to much higher fuel prices.
It’s clear the initial increase in prices led to increased demand. In March, CommBank reported a 161% increase in EV loan applications.
Since March 31, prices have decreased steadily, petrol prices are now only marginally higher than they were pre-conflict – yet EV sales figures remain high. There is some logic to this; buying a new car is typically a medium-term decision, and not typically an impulse purchase.
A range of EV incentives remain available in Australia, but there were no major policy changes during this period that would explain the spike in sales. It may be that ongoing uncertainty is driving continual demand or, that the increase in fuel prices due to the war has accelerated a structural shift in the market.
Charging your EV with solar
Charging an electric car at home with solar energy even further improves the financial case for owning an EV. Running costs come down well below those for Internal Combustion Engines (ICE). It is estimated that an extra 1.5kW to 2kW of solar capacity is enough to power the average electric car each year. If you plan on having two electric cars, then you’re looking at adding an extra 3 – 4kW of solar.
Bear in mind, you still need enough solar to charge the electrical appliances in your home. For most households, this means a solar system between 6.6kW to 13kW is typically about right. Our solar calculator can help to estimate the system size needed to meet both household electricity and EV charging requirements.
Sources and methodology
This page draws on monthly primary data from Australia’s new car sales reporting bodies.
Primary data sources
- National monthly and annual sales, and market share figures: Federal Chamber of Automotive Industries (VFACTS) and the Electric Vehicle Council (EVC)
- Brand and model EV sales figures: The Driven, compiled from VFACTS, EVC, and manufacturer-supplied data not otherwise publicly released
- Fuel price data: Australian Competition and Consumer Commission (ACCC), weekly fuel price monitoring
- Financing indicator: CommBank Newsroom
Definitions
EV sales figures refer to full battery electric vehicles (BEV) and do not include plug-in hybrid electric vehicles (PHEV).
Limitations
The EV brand and model figures are compiled independently by The Driven. They may not always tally up to the monthly reported figures from the FCAI and EVC due to reporting timing differences between manufacturers.
Update schedule
This page is updated monthly after the reporting of FCAI and EVC figures, typically before the 6th of each month.
 written byBy Michael Henderson