- Blog
- Solar Power
- Solar energy facts and statistics
Solar panel install statistics in Australia
- Solar Power
- 3 min read
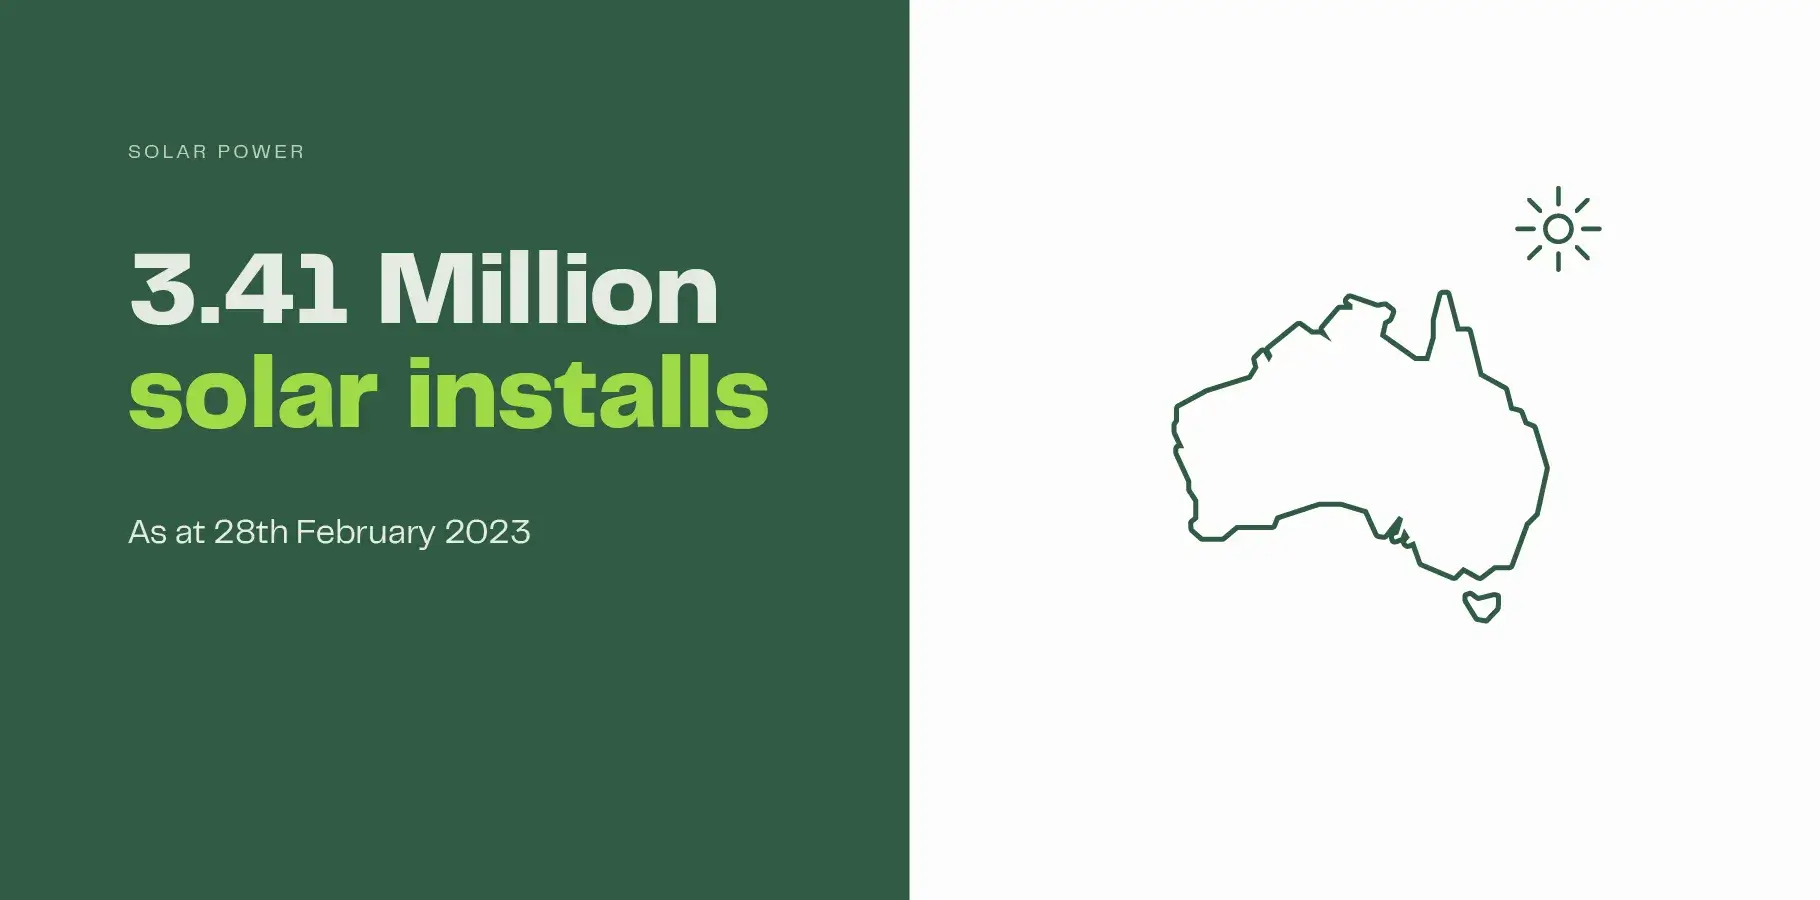
Over 4.4 Million homes and businesses in Australia have installed solar panels and are reaping the savings benefits of solar while also reducing their carbon emissions.
According to Australia’s Clean Energy Regulator, as at 16th June 2026, a total of 4.437 million solar power systems have been installed on Australian homes and small businesses.
With an estimated number of 10.9 Million homes in Australia, this brings the total of all households in Australia that have solar panels to 40.71%.
Australian solar panel install statistics
The number of solar systems installed in 2024 was 319,177, though this figure is likely to increase slightly as more installations are lodged. The table below shows Australian solar panel install statistics by calendar year.
| Year | Systems installed |
|---|---|
| Prior to 2016 | 1,509,422 |
| 2016 | 132,697 |
| 2017 | 174,942 |
| 2018 | 224,852 |
| 2019 | 284,031 |
| 2020 | 370,320 |
| 2021 | 377,458 |
| 2022 | 315,717 |
| 2023 | 333,865 |
| 2024 | 319,177 |
| 2025 | 269,865 |
| 2026 | 124,923 |
| Total | 4,437,269 |
Install statistics by state
Queensland leads all other states with 1,194,390 solar panel system installs as at 16th June 2026. However, it’s a slightly different story when we compare the percentage of solar installs per home; South Australia leads narrowly from Queensland with just over half of all households (56.68%) owning a solar system.
| State | Systems installed | Homes with solar (%) |
|---|---|---|
| ACT | 67,223 | 35.92% |
| NSW | 1,166,905 | 34.68% |
| NT | 25,642 | 26.55% |
| QLD | 1,194,390 | 54.40% |
| SA | 458,212 | 56.68% |
| TAS | 66,400 | 25.61% |
| VIC | 885,373 | 31.50% |
| WA | 573,124 | 49.82% |
2025 Installation figures
Installations are predicted to top over 270,000 in 2025 once final figures are compiled. There is a slight lag between the actual date of installations and the processing of the Small-scale Technology Certificates (STCs) which is recorded in the CER data when STCs are submitted to the Regulator. Even 2024 numbers continue to increase, now sitting at 319,177 installs.
*Small-scale installs include any system under 100kW in size. Predominantly, these are solar panels installed on household rooftops.
The Clean Energy Regulator originally forecast a sixth straight year of 300,000+ installs in 2025, before an expected gradual decline in future years. However, it now seems that installs will not surpass 300,000.
The table below shows future projections for solar panel installs in Australia:
| Year | Projected installs |
|---|---|
| 2025 | 270,000 |
| 2026 | 287,580 |
| 2027 | 287,110 |
| 2028 | 267,483 |
| 2029 | 258,258 |
Source: Clean Energy Regulator – STC projections.
Australians are installing larger systems
The average system size installed in Australian homes and small businesses in 2022 was 8.74 kW. Compare this to 2020 when the average system size installed was 7.92 kW. While the figures are skewed slightly higher to account for systems installed on small businesses, the upshot is that homeowners are choosing to put more panels on their roof and opt for a larger solar system.
Australian solar battery install statistics
Since the introduction of the solar battery rebate on July 1 2025, an incredible 401,185 new batteries have been installed in Australian homes and businesses, representing a 1,326% increase on 2024 installs.
Australia now boasts a total of 539,978 solar panel and battery units (hybrid systems), representing 12.17% of all solar owners.
In 2024, prior to the rebate, there were 31,305 solar battery installations, an increase of 15.95% on 2023 numbers.
The table below shows the number of battery installs with solar panels by calendar year:
| Year | Battery installs |
|---|---|
| 2014 | 693 |
| 2015 | 537 |
| 2016 | 1568 |
| 2017 | 4650 |
| 2018 | 5689 |
| 2019 | 8,563 |
| 2020 | 9,489 |
| 2021 | 13,168 |
| 2022 | 21,993 |
| 2023 | 26,955 |
| 2024 | 31,305 |
| 2025 | 218,982 |
| 2026 | 196,386 |
| Total | 539,978 |
Battery installs by state
The rate of battery installs per state is much closer than for solar panels. New South Wales leads the way, closely followed by Victoria and South Australia. It’s no coincidence that each of these states has adopted their own rebate program for solar batteries in the the lead up to the national incentive, Victoria’s rebate remains for solar panels while the New South Wales VPP battery rebate rewards customers that connect to a Virtual Power Plant (VPP).
| State | Batteries installed |
|---|---|
| ACT | 12,122 |
| NSW | 175,244 |
| NT | 3,575 |
| QLD | 103,665 |
| SA | 75,119 |
| TAS | 5,922 |
| VIC | 106,973 |
| WA | 57,358 |
Greater financial viability leading to increase in adoption
Solar batteries are becoming more financially viable due to the larger discrepancy between electricity costs and feed-in tariffs. Functionality like backup power is also proving to be very popular, as is the want to charge electric vehicles and, an increasing desire for energy independence.
Electrical vehicle uptake is increasing
Australia’s appetite for electric vehicles continues rise. Data prepared by the Electric Vehicle Council shows that 157,784 electric vehicles were sold in 2025 representing 13.1% of all new car sales. The 2025 figures have increased by 38% from 2024.
Encouragingly, EV sales represented 16.7% of all new cars sold in December 2025.
Electricity production in Australia
Renewable energy continues to contribute an increasing supply of Australia’s electricity needs. In 2024, 36% of Australia’s electricity came from renewable sources, up from 34% in 2023. Solar energy is now the largest source of renewable generation in Australia, in 2024, solar contributed 35% of all renewable generation and 15.3%.
While renewables power ahead, there is a long way to go. Renewable energy accounts for less than 10% of all energy sources in Australia.