- Blog
- Electricity bills
- Average electricity bills in Melbourne
Average electricity bills in Melbourne
- Electricity bills
- 4 minute read

One utility we cannot do without, even during a cost of living crisis, is electricity. How much should you be paying for your electricity bills in Melbourne?
We explore the average electricity bill in Melbourne by household size, season and even your network distributor.
Table of contents:
- The average electricity bill in greater Melbourne
- Average electricity bills for 1, 2, 3, 4 and 5+ households
- Electricity prices in Melbourne
- Peak and off-peak electricity times in Melbourne
- Electricity rebate for Melbourne households
- Average electricity bills with solar
According to the latest census data, the average greater Melbourne household is made up of 2.6 people 1. Using the electricity usage benchmark data 2 collated by the Australian Energy Regulator (AER), the average electricity bill in Melbourne is $458.53 per quarter, with daily usage at 13.65 kWh. Electricity usage in Melbourne is lower than the average household in Australia uses per day, mainly due to Melbourne’s reliance on gas supply. The average monthly electricity bill in Melbourne is $152.84.
These figures include the daily supply charge, a fixed cost for connecting to the grid.
The table below shows the daily, monthly, quarterly and annual electricity usage and bill figures for the average Melbourne household of 2.6 people
| Period | Electricity use | Bill amount |
|---|---|---|
| Daily | 13.65 kWh | $5.02 |
| Period | Electricity use | Bill amount |
|---|---|---|
| Monthly | 415 kWh | $152.84 |
| Period | Electricity use | Bill amount |
|---|---|---|
| Quarterly | 1,246 kWh | $458.53 |
| Period | Electricity use | Bill amount |
|---|---|---|
| Annually | 4,982 kWh | $1,834.12 |
Average electricity bills in Melbourne by season
If you’re wondering how much power you use in winter compared to the average, the table below shows the average bill amount and usage figures by season:
| Season | Monthly bill | Quarterly bill |
|---|---|---|
| Summer | $137.67 | $413.00 |
| Autumn | $140.31 | $420.93 |
| Winter | $193.35 | $580.04 |
| Spring | $140.05 | $420.15 |
Sources:
1 2021 Census data for Melbourne
2 AER electricity and gas benchmarks
Average electricity bills for 1, 2, 3, 4 and 5+ households
Of course, none of us live in a household of 2.6 people, it is a figure to represent the average for the whole city. Luckily, the AER data provides usage figures for 1, 2, 3, 4 and 5+ person households. We use this data to provide electricity bill averages for Melbourne households according to how many people live at your address.
Use the tabs on the table below to find the average bill amount to compare against your household:
| Household | Daily electricity use | Monthly bill | Quarterly bill |
|---|---|---|---|
| 1 Person | 8.09 | $105.61 | $316.84 |
| Household | Daily electricity use | Monthly bill | Quarterly bill |
|---|---|---|---|
| 2 Person | 13.26 | $149.52 | $448.57 |
| Household | Daily electricity use | Monthly bill | Quarterly bill |
|---|---|---|---|
| 3 Person | 13.91 | $155.06 | $465.17 |
| Household | Daily electricity use | Monthly bill | Quarterly bill |
|---|---|---|---|
| 4 Person | 15.90 | $171.99 | $515.97 |
| Household | Daily electricity use | Monthly bill | Quarterly bill |
|---|---|---|---|
| 5 Person | 20.14 | $208.00 | $623.99 |
The average bill for a single person household in Melbourne
The average daily electricity use for those living on their own in Melbourne is 8.09 kWh per day. The average monthly bill is $105.61 while the quarterly electricity bill is $316.84.
This data is presented in the table below:
| Household | Daily electricity use | Monthly bill | Quarterly bill |
|---|---|---|---|
| 1 Person | 8.09 | $105.61 | $316.84 |
Average electricity bill in Melbourne for a 2-person household
Electricity usage for 2-person households jumps considerably to 13.26 kWh per day.
The table below shows the average usage, monthly and quarterly bill amounts for 2-person households in Melbourne:
Melbourne has a relatively high proportion of gas users compared to most other states, which explains the lower electricity use. However, gas aside, Melbourne bills are lower than the average electricity bill in Sydney.
| Household | Daily electricity use | Monthly bill | Quarterly bill |
|---|---|---|---|
| 2 Person | 13.26 | $149.52 | $448.57 |
Average electricity bills for 3, 4 and 5+ person households
As you might expect, the electricity usage increases with each increase in the number of people per household.
The table below shows the daily usage, average monthly bill and quarterly bill for 3-person, 4-person and 5+ person households in Melbourne:
| Household | Daily electricity use | Monthly bill | Quarterly bill |
|---|---|---|---|
| 3 Person | 13.91 | $155.06 | $465.17 |
| 4 Person | 15.90 | $171.99 | $515.97 |
| 5 Person | 20.14 | $208.00 | $623.99 |
Electricity prices in Melbourne
When comparing electricity prices, we are looking at two costs: the usage cost per kWh and the fixed cost for connecting to the network (daily supply charge).
To find the average price of electricity in Melbourne, we analysed plans from the top retailers by market share in each distribution zone.
The average cost of electricity per kWh in Melbourne is 27.94c and the average daily supply charge is $1.21 per day, as shown in the table below:
| Cost / kWh | Daily supply charge | Average | 27.94c | $1.21 |
|---|
Melbourne prices by distributor
The greater Melbourne area is served by no less than five electricity distributors. By contrast, south-east Queensland only has one distributor which may explain Brisbane’s higher electricity rates. Each distributor faces different network costs, which are effectively passed onto retail customers. Electricity prices in Melbourne really depends on where you live and therefore who your distributor is.
The five network distributors that provide electricity to the greater Melbourne area are:
- AusNet
- CitiPower
- Jemena Power
- Powercor
- United Energy
Electricity prices in Melbourne vary considerably according to distribution zone, as shown in the table below:
| Distributor | Cents / kWh | Daily supply charge |
|---|---|---|
| AusNet | 33.01 | $134.68 |
| CitiPower | 25.14 | $116.79 |
| Jemena Power | 27.34 | $115.82 |
| Powercor | 27.68 | $128.54 |
| United Energy | 26.53 | $109.81 |
Your electricity plan also impacts the cost of electricity
Electricity prices in Melbourne vary by retailer and the type plan that you select. Plans are typically either single rate plans or time of use plans. A single rate plan means that you are charged the same rate no matter when you use electricity.
A time of use plan has different costs per kWh depending on whether it is during peak hours, or off-peak times.

The Victorian Default Offer: How electricity prices in Melbourne are set
Electricity retailers are now free to set their own Victorian feed-in tariffs and electricity prices. However, the the Essential Services Commission (ESC) still oversees the market and provides the Victorian Default Offer (VDO) – a price ceiling that retailers must abide by.
he Default Offer is a price maximum that retailers cannot exceed for the cost of electricity per kWh and the daily supply charge.
Victorian Default Offer prices for 2025-26
The Essential Services Commission sets prices according to distribution zone. The current prices are available on the ESC website 3 and presented in the table below:
| Distributor | Cost / kWh | Controlled load (Cost / kWh) | Daily supply charge |
|---|---|---|---|
| AusNet | 0.3477* | $0.2399 | $1.41 |
| CitiPower | $0.2733 | $0.2012 | $1.2407 |
| Jemena | $0.2972 | $0.2314 | $1.2301 |
| Powercor | $0.3009 | $0.2122 | $1.3684 |
| United Energy | $0.2884 | $0.2107 | $1.1648 |
* AusNet: Rate applies to first 1,020 kWh per quarter
Source:
3 ESC Website: Victorian Default Offer
Retailers provide discounts to the VDO
Retailers offer the standard rates, but they typically also provide plans at a discount to the VDO, sometimes referred to as market offers. The average prices we have used are all from discount offer plans.
What’s ahead in 2027?
The ESC is considering mandating 3 hours free electricity during the middle hours of the day in response to the Default Market Offer announcement by the Australian government.
Accessing green power in Melbourne
You can access green power in Melbourne, if you choose to pay more for your electricity. Most retailers provide this option, which can either be:
- 20% of your electricity use for $1 per week
- 100% of your electricity use at 4.4c per kWh
These rates are just an example, the average cost of green power in Melbourne may be slightly higher.
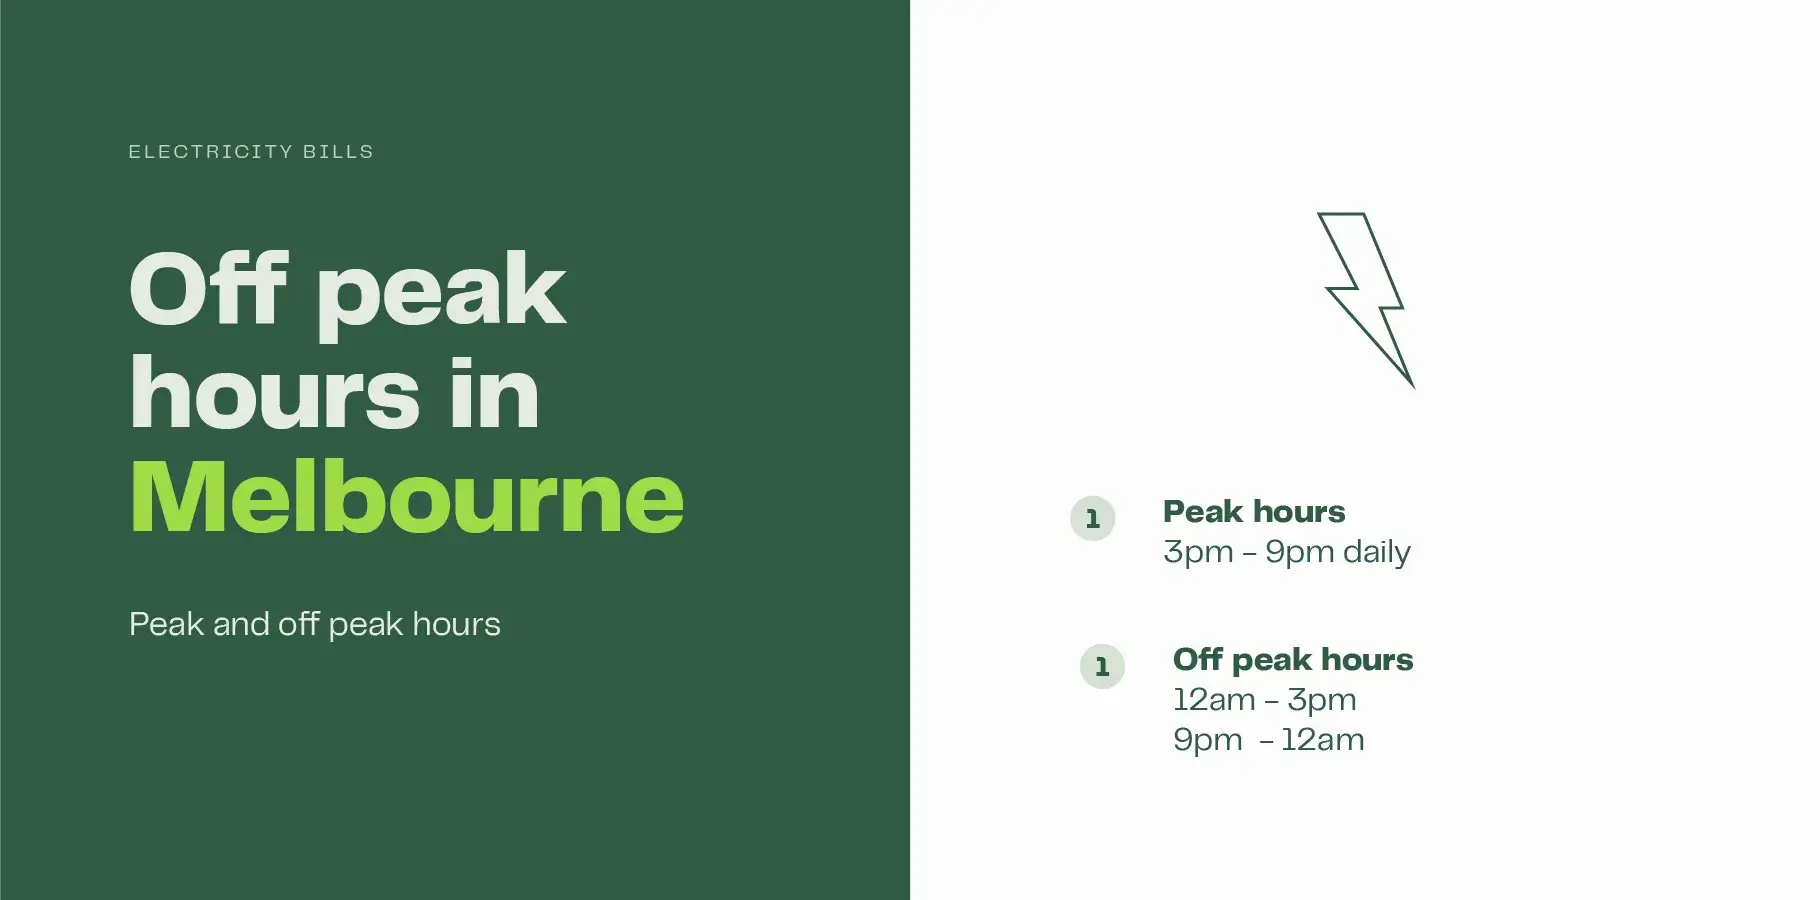
Peak and off-peak electricity times in Melbourne
For those on a time-of-use plan, it’s important to pay close attention to the peak and off-peak electricity times in Melbourne. The exact time periods vary by retailer, so it’s best to check the plan that you are on.
Peak tariff times are simplified in Melbourne, it is typically between 3pm – 9pm each day. Off-peak electricity times in Melbourne are 9pm – 3pm the next day.
| Peak hours | Off-peak hours |
|---|---|
| 3pm – 9pm daily | 12am – 3pm and 9pm – 12am daily |
Electricity rebate for Melbourne households
The electricity rebate available to Melbourne households has now run its course. The final rebate was a $150 electricity rebate in 2025-26 thanks to a combined initiative from the federal and state governments 4. The rebate is not continuing in the 2026 calendar year.
The former $250 Power Saving Bonus initiative has now closed.
Small business rebate
Likewise, the small businesses rebate is no longer available.
4 Source: Victorian energy bill relief
Victorian solar rebate
The household energy rebate should not be confused with the Victorian solar rebate. A range of rebates are available to eligible households in Victoria that install solar panels.
Average electricity bills with solar
Installing solar panels is one measure that can reduce electricity bills. Given the popularity and benefits of installing solar in Melbourne, it’s worth considering what the average bill with solar could be.
We will use a standard 6.6kW solar system to explain the savings:
Assuming an average electricity bill of $455 per quarter, it is estimated that a 6.6kW system can deliver annual savings of $897 in Melbourne.
Note: These figures do not include the Victorian solar rebate.
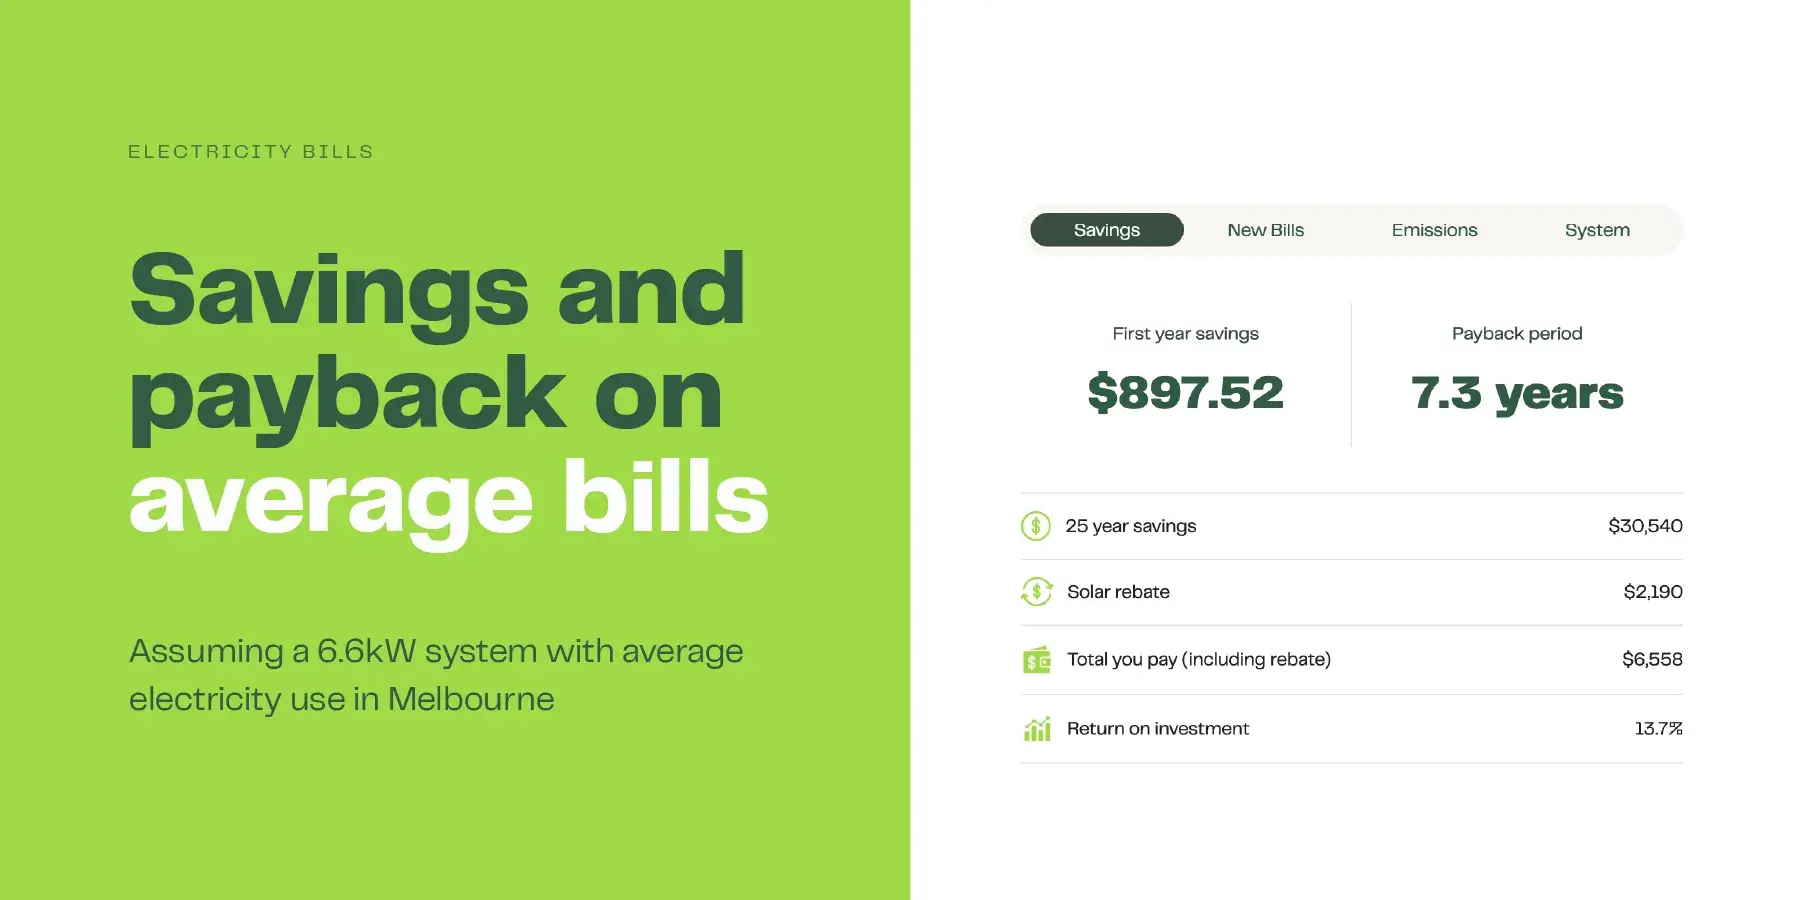
These savings would take the average electricity bill in Melbourne down to $230 per quarter, a $225 bill saving. The new monthly bill is estimated to be $77.

Other savings measures
It’s worth mentioning that solar is not the only way of saving on electricity bills. There are several other tips to save on electricity that are well suited to Melbourne’s cooler climate e.g. insulation, energy efficient appliances, LED lighting and thermostat adjustments.
Get an accurate estimate for your property
Calculating solar gains accurately requires a little more information and you’ll want to use your actual electricity bill amount. There are two ways that you can get accurate savings figures on our site:
- 1. Use our Solar Calculator
- 2. Get quotes from accredited installers
Our solar calculator takes you through a quiz where you can get accurate figures for installing solar panels.
Alternatively, if you have more specific questions relating to your property, you can ask up to three installers from our network to provide quotes for installing a good system.