- Blog
- Renewable energy
- Australian electricity generation by source
Australian electricity generation by energy source
- Renewable energy
- 5 min read
Australia’s electricity generation is increasing every year. In 2024, Australia generated nearly 284 terawatt hours of electricity, with just over a third of it powered by renewable sources.
In recent years, renewable energy sources like solar, wind and hydropower have helped reduce Australia’s heavy reliance on fossil fuels. However, more renewables are needed if Australia is to meet its target of 82% electricity from renewable sources by 2030.
Solar generation is a real bright spot for the country in its transition to a renewable-powered grid. Solar power is now the second largest source of electricity in Australia.
A look through the different states in Australia tells a slightly different tale. Fossil fuels are still dominant in our three major electricity generating states: New South Wales, Queensland and Victoria. Energy consumption statistics also show that fossil fuels still dominate the country’s energy mix.
In this article, we take an in-depth look at electricity sources in Australia.
Total electricity generation
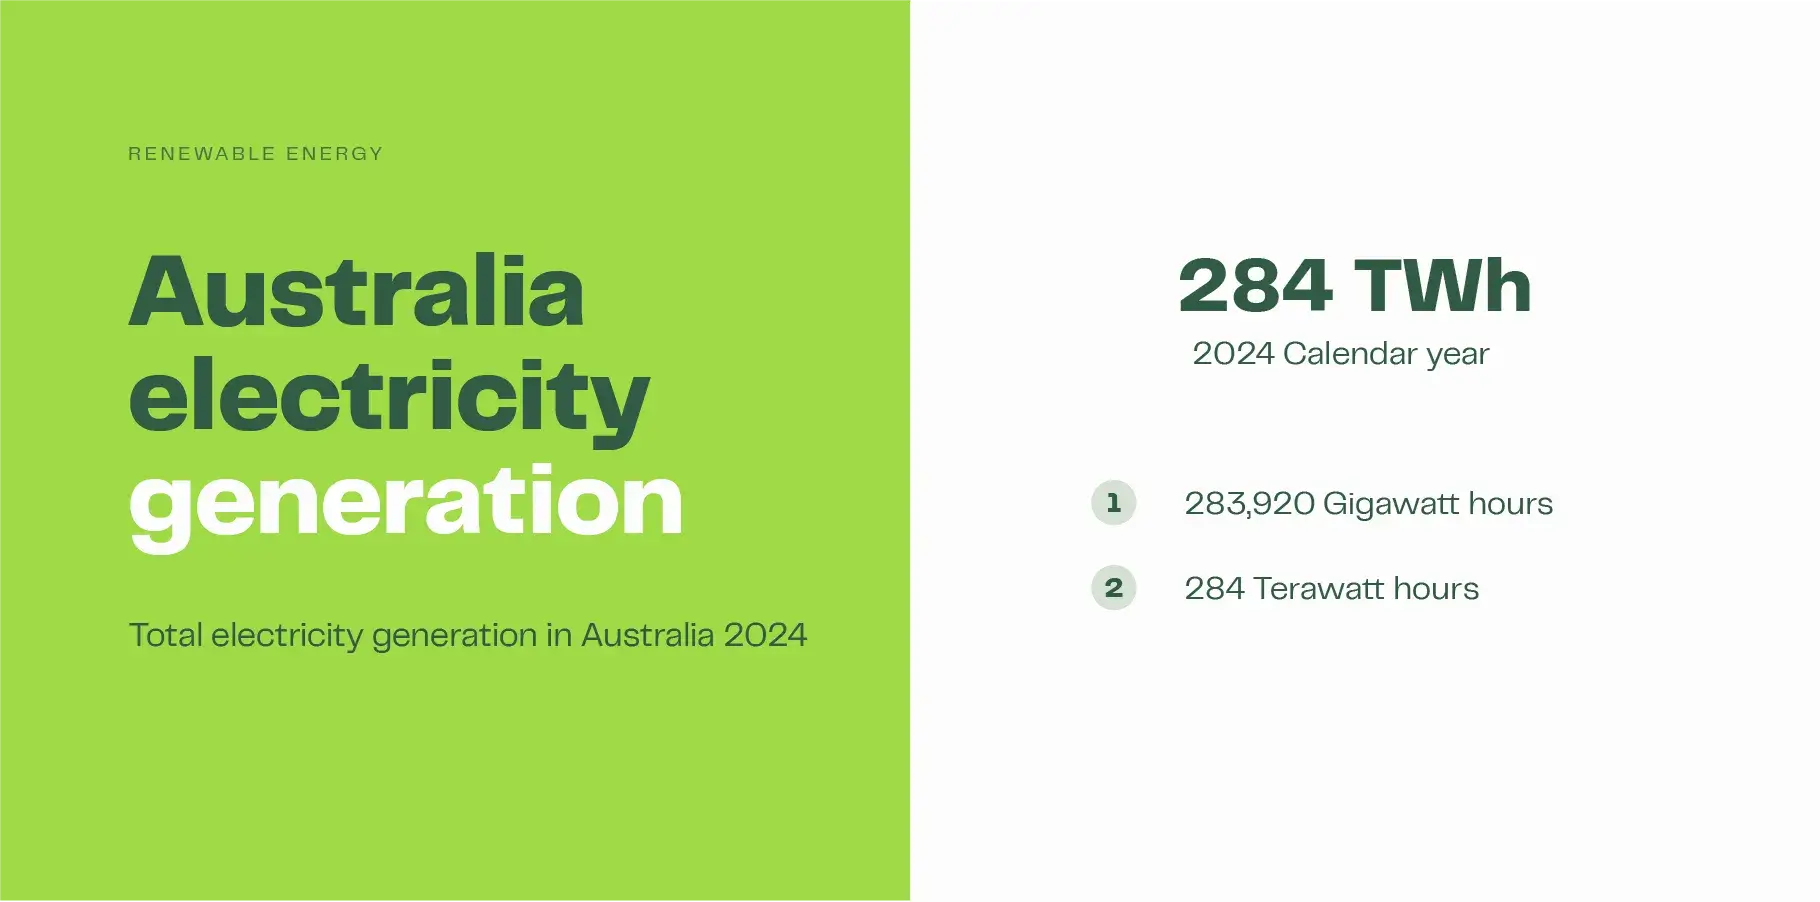
Australian energy figures are released annually by the federal government. Typically, the figures trail the calendar date by between 9 – 18 months. As at February 2026, the latest published data is for the 2024 calendar year.
In 2024, Australia generated a record 283,920 gigawatt hours of electricity from all sources. Renewable energy contributed a record 36.1% of all electricity (102,403 gigawatt hours).
Electricity generation for the 2024 calendar year
| Energy category | Electricity generation (GWh) |
|---|---|
| Fossil fuels generation | 181,517 |
| Renewables generation | 102,403 |
| Total generation | 283,920 |
Total electricity generation 5-year comparison
Total electricity generation in Australia has grown 7.1% in the five years since 2019 1. The renewable energy contribution to Australian electricity generation has grown 84.6% since 2019.
| 2019 | 2024 | Increase | |
|---|---|---|---|
| Fossil fuels generation | 209,636 | 181,517 | -13.4% |
| Renewables generation | 55,481 | 102,403 | 84.6% |
| Total generation | 265,117 | 283,920 | 7.1% |
Source:
1 Australian energy figures 2019
Electricity generation by source
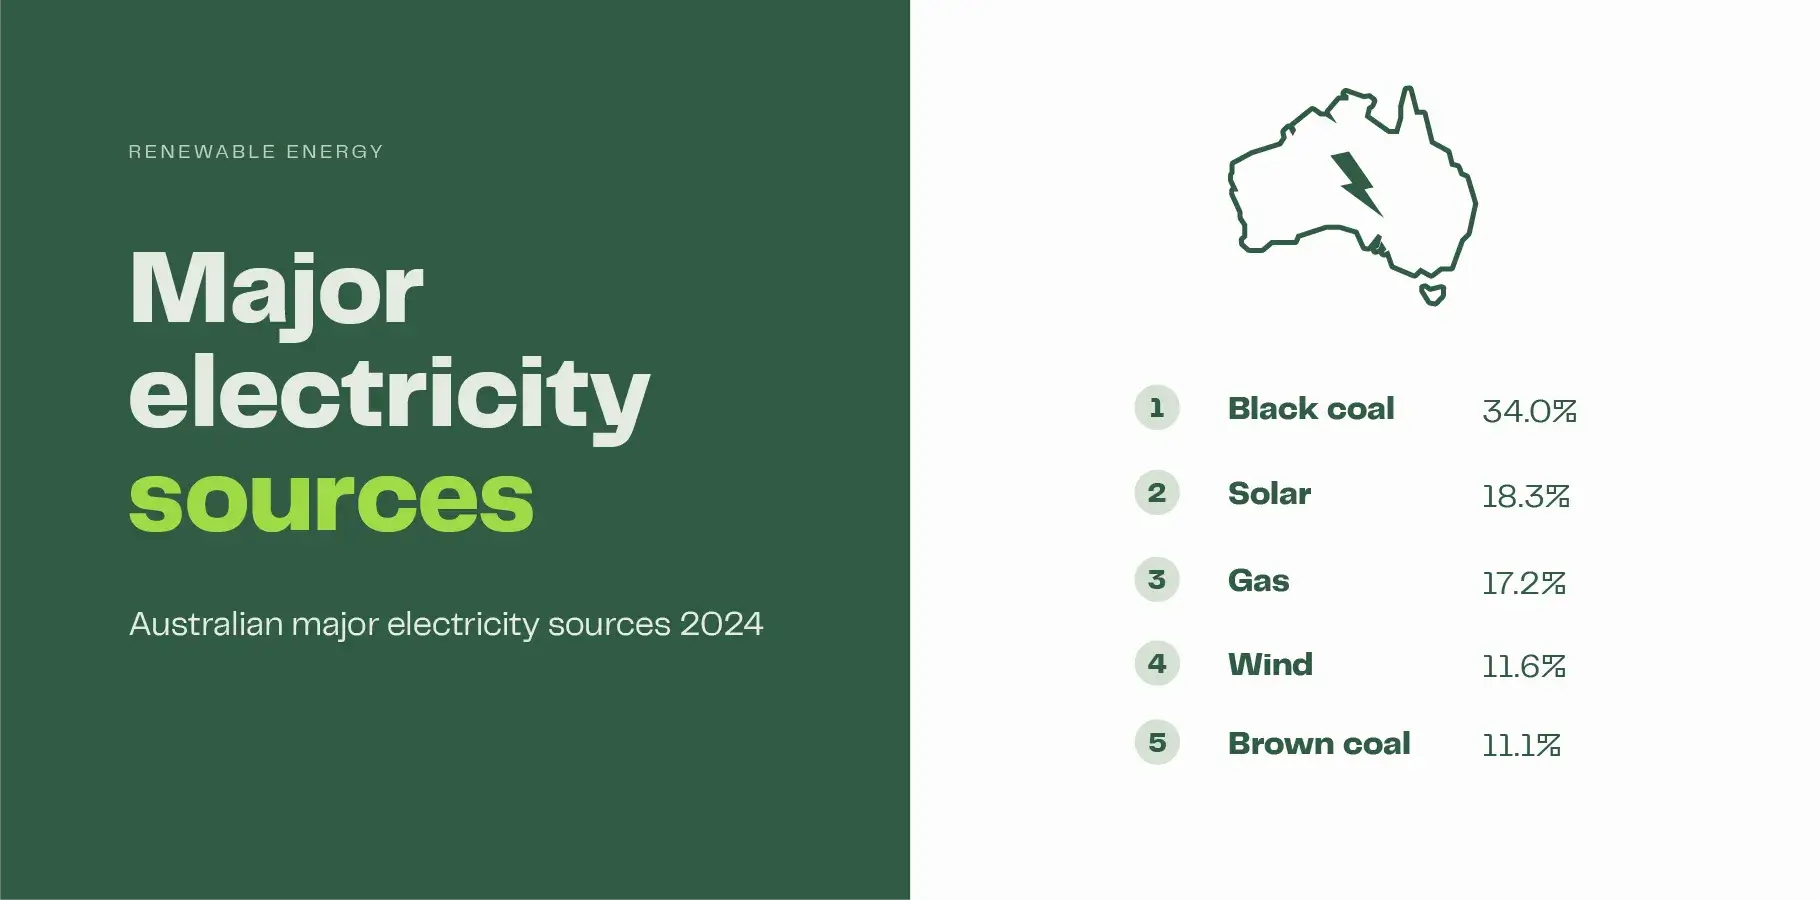
In the 2024 calendar year, Black coal was Australia’s largest source of electricity contributing 34.0% of total generation. For the first time, solar PV (photovoltaics) was the second largest source of electricity, generating 18.3%.
The table below shows Australia’s electricity generation by source in 2024:
| Category | Energy source | Electricity (Gigawatt-hours) | % of Total |
|---|---|---|---|
| Fossil fuels | Black coal | 96,391 | 34.0% |
| Brown coal | 31,413 | 11.1% | |
| Gas | 48,844 | 17.2% | |
| Oil | 4,869 | 1.7% | |
| Renewables | Solar PV | 51,849 | 18.3% |
| Wind | 32,894 | 11.6% | |
| Hydro | 14,230 | 5.0% | |
| Bioenergy | 3,430 | 1.2% | |
| Total generation | 283,920 |
Latest 2025 data
The National Electricity Market (NEM) connects Queensland, New South Wales, Victoria, South Australia, Tasmania and the Australian Capital Territory to the one grid. In its recent quarterly report, the Australian Energy Market Operator (AEMO) reported that renewables contributed 51% of all electricity supply to the NEM in the last quarter of 2025. The sunnier spring and summer conditions obviously help boost these figures, but it is the first-time renewables have supplied more than half of the electricity to the national grid.
Electricity generation for Australian states
Electricity generation in Australia varies across the different states and territories. New South Wales and Queensland are the country’s two largest electricity generators, though NSW’s figures include the Australian Capital Territory. The table below shows electricity generation by state in Australia:
| State | Electricity generation (GWh) | Australian % |
|---|---|---|
| NSW | 76,846.2 | 27.1% |
| QLD | 74,790.0 | 26.3% |
| VIC | 56,271.9 | 19.8% |
| WA | 45,580.3 | 16.1% |
| SA | 15,365.8 | 5.4% |
| TAS | 9,726.2 | 3.4% |
| NT | 5,339.6 | 1.9% |
Renewable energy electricity generation by state
When it comes to generating electricity, Tasmania – the Apple Isle – is, the apple of Australia’s eye, generating 94.7% of its electricity from renewable sources. South Australia is next best, generating 74.3% of its electricity from renewable energy sources.
The table below shows what percentage of electricity is generated from renewable sources in each state in Australia:
| State | Renewables % | Fossil fuels % |
|---|---|---|
| TAS | 94.7% | 5.3% |
| SA | 74.3% | 25.7% |
| VIC | 40.6% | 59.4% |
| NSW | 36.8% | 63.2% |
| QLD | 28.6% | 71.4% |
| WA | 19.4% | 80.6% |
| NT | 7.5% | 92.5% |
State-by-state breakdown of electricity sources
The table below shows electricity sources for each state and territory in Australia:
| State | Source | Electricity generation (GWh) | % Of total |
|---|---|---|---|
| NSW (w ACT) | Black coal | 45,813 | 59.6% |
| NSW (w ACT) | Brown coal | 0 | 0.0% |
| NSW (w ACT) | Gas | 2,124 | 2.8% |
| NSW (w ACT) | Oil | 595 | 0.8% |
| NSW (w ACT) | Solar PV | 17,593 | 22.9% |
| NSW (w ACT) | Wind | 6,612 | 8.6% |
| NSW (w ACT) | Hydro | 3,083 | 4.0% |
| NSW (w ACT) | Bioenergy | 1,026 | 1.3% |
| NSW (w ACT) | Total | 76,846 |
New South Wales
Black coal remains the source of a significant amount of electricity in NSW, contributing 59.6%. Renewables account for 36.8% of the state’s electricity generation, in line with the national average.
Solar PV provides 22.9% of New South Wales’ electricity. Household solar is a major contributor (12.8%), driven by strong solar uptake in Sydney and Newcastle.
| State | Source | Electricity generation (GWh) | % Of total |
|---|---|---|---|
| VIC | Black coal | 0 | 0.0% |
| VIC | Brown coal | 31,413 | 55.8% |
| VIC | Gas | 1,830 | 3.3% |
| VIC | Oil | 206 | 0.4% |
| VIC | Solar PV | 8,205 | 14.6% |
| VIC | Wind | 11,164 | 19.8% |
| VIC | Hydro | 2,720 | 4.8% |
| VIC | Bioenergy | 734 | 1.3% |
| VIC | Total | 56,272 |
Victoria
Brown coal still accounts for well over half (55.8%) of Victoria’s electricity generation. Wind remains Victoria’s largest renewable source of electricity (19.8%). Solar contributes 14.6% of Victoria’s electricity generation, and the state government continues to support solar adoption with its Solar Victoria rebate.
| State | Source | Electricity generation (GWh) | % Of total |
|---|---|---|---|
| QLD | Black coal | 42,884 | 57.3% |
| QLD | Brown coal | 0 | 0.0% |
| QLD | Gas | 9,300 | 12.4% |
| QLD | Oil | 1,217 | 1.6% |
| QLD | Solar PV | 15,578 | 20.8% |
| QLD | Wind | 2,904 | 3.9% |
| QLD | Hydro | 1,464 | 2.0% |
| QLD | Bioenergy | 1,443 | 1.9% |
| QLD | Total | 74,790 |
Queensland
Despite solar power contributing a healthy 20.8% of the state’s electricity generation, Queensland still generates 57.3% of its electricity from black coal. Fossil fuels generate 71.4% of all electricity in Queensland.
Powered by the value of the solar rebate in Queensland, solar generation is nearly double that of Victoria.
| State | Source | Electricity generation (GWh) | % Of total |
|---|---|---|---|
| WA | Black coal | 7,695 | 16.9% |
| WA | Brown coal | 0 | 0.0% |
| WA | Gas | 26,944 | 59.1% |
| WA | Oil | 2,090 | 4.6% |
| WA | Solar PV | 4,904 | 10.8% |
| WA | Wind | 3,783 | 8.3% |
| WA | Hydro | 72 | 0.2% |
| WA | Bioenergy | 93 | 0.2% |
| WA | Total | 45,580 |
Western Australia
In 2024, 80.6% of Western Australia’s electricity generation came from fossil fuels. Solar generated 10.8% of the state’s power, most of it from home rooftop systems.
WA is the nation’s largest producer of gas-sourced electricity. Gas generates 59.1% of all electricity in the state.
| State | Source | Electricity generation (GWh) | % Of total |
|---|---|---|---|
| SA | Black coal | 0 | 0.0% |
| SA | Brown coal | 0 | 0.0% |
| SA | Gas | 3,712 | 24.2% |
| SA | Oil | 244 | 1.6% |
| SA | Solar PV | 4,774 | 31.1% |
| SA | Wind | 6,546 | 42.6% |
| SA | Hydro | 1 | 0.0% |
| SA | Bioenergy | 89 | 0.6% |
| SA | Total | 15,366 |
South Australia
Solar energy delivers a higher proportion of electricity in South Australia (31.1%) than all other states in Australia. Small-scale solar systems deliver the majority of the state’s solar-powered electricity (22.8%) and dwarf NSW, the next best state (12.8%).
All up, renewables power 74.3% of South Australia’s electricity generation.
| State | Source | Electricity generation (GWh) | % Of total |
|---|---|---|---|
| TAS | Black coal | 0 | 0.0% |
| TAS | Brown coal | 0 | 0.0% |
| TAS | Gas | 502 | 5.2% |
| TAS | Oil | 13 | 0.1% |
| TAS | Solar PV | 402 | 4.1% |
| TAS | Wind | 1,884 | 19.4% |
| TAS | Hydro | 6,889 | 70.8% |
| TAS | Bioenergy | 36 | 0.4% |
| TAS | Total | 9,726 |
Tasmania
Tasmania sources 94.7% of its electricity from renewable energy sources. Hydropower accounts for 70.8% of Tasmania’s power generation, wind 19.4% and solar 4.1%.
Tasmania’s history with hydropower and its environmental disruption is well known; along with the high capital cost of development, it is often one of the disadvantages cited for renewable energy.
| State | Source | Electricity generation (GWh) | % Of total |
|---|---|---|---|
| NT | Black coal | 0 | 0.0% |
| NT | Brown coal | 0 | 0.0% |
| NT | Gas | 4,432 | 83.0% |
| NT | Oil | 505 | 9.5% |
| NT | Solar PV | 394 | 7.4% |
| NT | Wind | 0 | 0.0% |
| NT | Hydro | 0 | 0.0% |
| NT | Bioenergy | 9 | 0.2% |
| NT | Total | 5,340 |
Northern Territory
Despite being the lowest generator of electricity in the country, the Northern Territory is the third largest supplier of gas-sourced electricity. Gas is the source of 83% of all the Territory’s power.
It’s renewable energy mix almost entirely comes from solar power (7.4%).
The growth of renewable energy sources
The growth of renewable energy in recent years is encouraging. In 2019, Solar only contributed 6.9% of Australia’s electricity. It now generates 18.3%. Wind has increased too. In 2019 wind power contributed 7.4% of Australia’s electricity, it now generates 11.6%. Both hydropower and bioenergy have remained steady in this time.
| Energy source | 2019 | 2024 | 5-year % |
|---|---|---|---|
| Black coal | 116,359 | 96,391 | -17.2% |
| Brown coal | 33,137 | 31,413 | -5.2% |
| Gas | 54,357 | 48,844 | -10.1% |
| Oil | 5,783 | 4,869 | -15.8% |
| Solar PV | 17,951 | 51,849 | 188.8% |
| Wind | 19,524 | 32,894 | 68.5% |
| Hydro | 14,430 | 14,230 | -1.4% |
| Bioenergy | 3,576 | 3,430 | -4.1% |
| Total | 265,117 | 283,920 |
Reliance on coal generation decreases
Coal is still Australia’s major source of electricity generation. However, our reliance on coal is decreasing. In 2019, black and brown coal contributed 56.4% of Australia’s electricity, whereas now, they contribute 45%.
Renewable growth figures tell the story
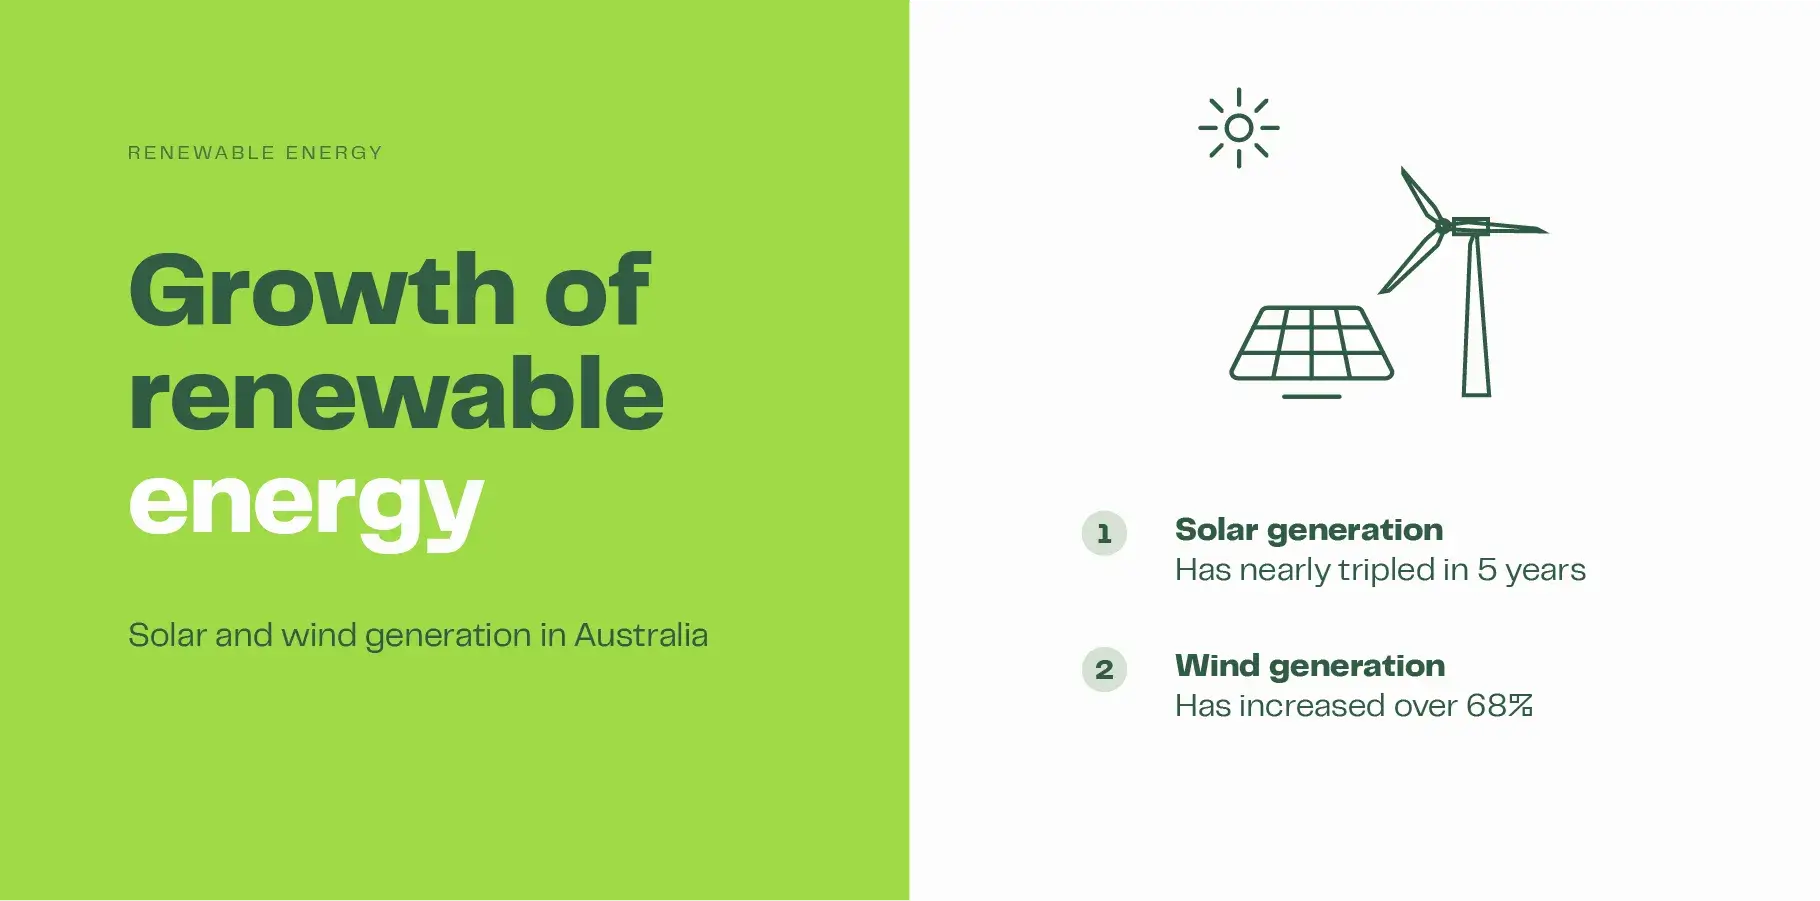
The most compelling statistic to explain the trend in Australian electricity generation is to look at the 5-year trend. Since 2019, solar electricity generation has grown 188.8%. Wind generation has grown 68.5%. All other sources of electricity have decreased, most notably black coal, which is down 17.2% on 2019 figures.
Solar Energy is Australia’s rising star
The emergence of solar power as an energy force in Australia cannot be underestimated. Small-scale solar systems contribute 11.5% of Australia’s electricity generation, and many households are assessing their savings potential using tools like an online solar calculator which estimates, installation costs, return on investment, annual savings and new bill amounts with solar. The strong financial returns for household solar help explain the growth in renewable energy generation. In 2024, electricity generation from home solar power systems even outstripped brown coal.
They key driver for household solar adoption is that it remains the most effective way to save on electricity bills and add value to your home.
Utility, or large-scale, solar contributed 6.8% of Australia’s electricity in 2024. Since 2019, large-scale solar has increased generation by 250.6%.
Government renewable targets
The Australian government has set a renewable energy target to source 82% of all its electricity from renewable sources by 2030. In 2019, renewables accounted for 20.9% of all electricity and in 2024 the figure has risen to 36.1%. Australia must make a huge jump to reach 82% by 2030.
Incentives to reach targets
The government is though providing incentives to encourage the transition to renewables. The current solar battery rebate is one recent initiative designed to increase the uptake of battery storage. State governments and electricity retailers are also providing incentives to connect household solar batteries to virtual power plants (VPPs).
The solar panel rebate is set to end in 2030, aligning with the renewable energy target.
These home storage initiatives have so far proved successful, nearly 200,000 batteries were installed in the second half of 2025.